
Last updated on October 4th, 2021 at 11:38 am
Aditya Birla Sun Life IPO Subscription Status
Subscription Status {no. of times (x)}
[su_table]
|
Particulars |
Shares Offered | 29th Sep | 30th Sep | 1st Oct |
| QIB | 73,87,200 | 0.00 | 0.06 |
10.36 |
|
NII |
55,40,400 | 0.14 | 0.40 | 4.39 |
| Retail | 1,29,27,600 | 1.09 | 2.00 |
3.24 |
|
Others |
19,44,000 | 0.31 | 0.71 | 1.68 |
| Total | 2,77,99,200 | 0.56 | 1.08 |
5.25 |
[/su_table]
Key Financial Highlights
- Revenue from operations for Q1FY22 increased by 30% to Rs 333.24 crore as compared to Rs 256.62 crore in Q1FY21. The increase was attributable to a rise in total AAUM which in turn resulted in increased commissions.
- Total revenues for the last two years, FY21 and FY20 have registered a slight fall when compared to previous years. The revenues were reduced by 2.34% to Rs 1205.84 crore in FY21 from Rs 1233.84 crore. Loss of investor sentiment during the pandemic and volatile market led to a decrease in total AAUM during the last two years.
- PAT shows an increasing trend for all the last three fiscals. PAT has been increasing despite the fall in AAUM due to a decrease in the prepaid commission expenses as a result of the trailing effect of the 2018 SEBI Circular as well as lower commission expenses incurred in connection with portfolio management services in line with a decrease in portfolio management services AAUM.
- The Issue is priced at 33x of its earnings (annualized EPS of 21.52) at the upper price band of Rs 712 per share. The Issue appears to be fully priced when compared to the industry average of 39.84x.
- P/BV of the Issue is 11.38x with NAV of Rs 62.57 as on 30th June 2021.
- The listed peers of the Issuer are HDFC AMC, Nippon Life AMC, and UTI AMC. SBI Life AMC and ICICI Prudential AMC are the unlisted peers.
Aditya Birla Sun Life AMC Limited IPO- Know all about it
Valuation Parameters
[su_table]
| Valuation Parameters | EPS | P/E | NAV | P/BV | ||
| 21.52 | 33.08 | 62.57 | 11.38 |
[/su_table]
Comparison with the listed peers
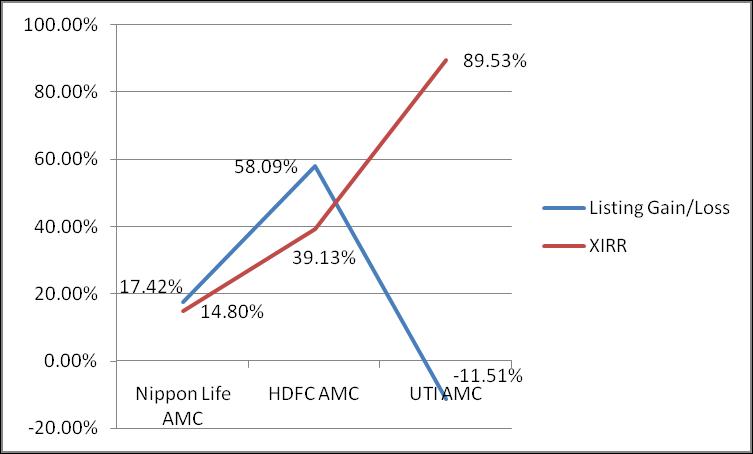
We have analyzed the returns given by the AMCs listed in the chart below. The chart below shows the listing gains at the time of listing and the returns after listing. Returns are compared on the XIRR basis which also takes the time value of the money for the investment. One can notice that the UTI AMC which is the most recent one to be listed has given the highest returns. Having said that, it’s important to note that all the AMC listed companies have given impressive returns.
Chart showing returns from listed AMCs
Investment Strategy of Aditya Birla Sun Life IPO
ABSL is one of the largest AMC’s with an overall market share of 8.3%. The AMC has total MAAUM of Rs 2837 billion and equity MAAUM of Rs 1080 billion. The business mix consists of 59.5% non-equity AUM of around Rs 1748 billion, 36.5% is equity AUM amounting to Rs 1073 billion and the rest is alternate assets at Rs 115 billion AUM.
The mutual fund industry is highly underpenetrated in India, increasing household savings and awareness about the financial products, digitization, and eased regulatory reforms would drive the growth in the sector.
ABSL AMC has maintained a market-leading position in B-30 penetration over the years which contributed to the growth of the individual investor base as well as improvement in profitability. The AMC is also aiming at increasing its equity mix to generate higher profitability. Hence one may subscribe to the IPO.

- One MobiKwik Systems Limited, MobiKwik IPO - 14/10/2021
- Bharti Airtel Rights Issue- Should You Subscribe? - 07/10/2021
- How to Check your IPO Allotment status? - 28/09/2021
Disclaimer: The above content is for general info purpose only and does not constitute professional advice. The author/ website will not be liable for any inaccurate / incomplete information and any reliance you place on the content is strictly at your risk.
Follow us on Social Media by clicking below
Follow @financepost_in
Be the first to comment