
Last updated on July 7th, 2021 at 08:49 pm
Key Financial Highlights of Clean Science and Technology
- Robust Financial Performance: The company’s total revenue increased by 25% in FY21 to Rs 538.07 crore from Rs 430.17crore for FY20. PAT posted for FY21 was Rs 198 crore in FY21 as against Rs 139 crore in FY20.
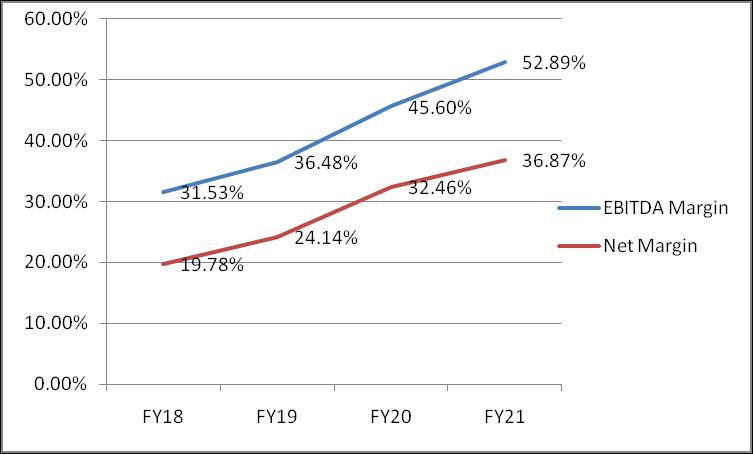
- The Issuer posted strong EBITDA and net margins as plotted in the chart.
- RoNW for FY21 is 37%. The Issuer has negligible debt on the books.
- With an EPS of 18.68 per share, the P/E is 48.18 times calculated at the upper price band of Rs 900 per share. The average sector P/E is 55.38x indicating the Issue to be fully priced.
- P/BV is 17.71x at an upper price band of Rs 900 per share.
Business analysis of Clean Science and Technology IPO
Chart showing margins
Valuation Parameters
[su_table]
| Valuation Parameters | EPS | P/E | NAV | P/BV |
| 18.68 | 48.18 | 50.81 | 17.71 |
[/su_table]
Peers Key Financial Metrics
| Peer Comparison | Total Income (FY21) | EPS | P/E | RoNW |
| Vinati Organics | 980.1 | 26.2 | 68.43 | 17.45% |
| Fine organics | 1150.3 | 39.25 | 75.93 | 16.45% |
| Atul | 3834.5 | 221.17 | 40.01 | 17.11% |
| Camlin Fine | 1192.1 | 4.13 | 47.65 | 9.16% |
| SRF Limited | 8454.5 | 205.54 | 34.37 | 17.47% |
| Navin Fluorine | 1258.4 | 52.03 | 64.43 | 15.76% |
| PI Industries | 4701.9 | 49.92 | 56.83 | 13.82% |
| Clean Science | 538.1 | 18.68 | 48.18 | 36.76% |
[/su_table]
Investment Strategy- Subscribe
Clean Science and Technology Company is a global company focused on manufacturing speciality chemicals. The company has a niche market segment. Issuer’s financial performance is robust with strong margins and low debt levels. Hence, one may subscribe to the IPO.
RHP of Clean Science and Technology IPO

Chartered Accountant & an experienced credit analyst. She has worked with CRISIL as a Senior Credit Analyst on rating assignments including business & financial analysis in Corporates as well as the Public Finance Sector. Please mail your queries, feedback, and any suggestions to her on info.financepost@gmail.com
Latest posts by CA Priyanka Choudhary Jain (see all)
- One MobiKwik Systems Limited, MobiKwik IPO - 14/10/2021
- Bharti Airtel Rights Issue- Should You Subscribe? - 07/10/2021
- How to Check your IPO Allotment status? - 28/09/2021
Disclaimer: The above content is for general info purpose only and does not constitute professional advice. The author/ website will not be liable for any inaccurate / incomplete information and any reliance you place on the content is strictly at your risk.
Follow us on Social Media by clicking below
Follow @financepost_in
Be the first to comment